
S&P 500 Stock Prices Analysis
- Blessing Okakwu
- Nov 11, 2021
- 2 min read
This is an analysis of the S&P 500 stock prices.

According to Wikipedia, the S&P 500 is a stock market index tracking the performance of 500 large companies listed on stock exchanges in the united states. The list usually constitutes 505 companies. This analysis is on the S&P 500 list for 2014 to 2017.
This analysis aims to analyse the changes in stock prices for these companies for the four years under review and suggest possible stock options to invest in.
There are 505 companies on this list, the average lowest price for the entire stock combined was $85.55 and the average highest price was $87.13.

Using SQL to identify the date with the highest trading volume shows that 24/08/2015 recorded the highest trading volume.

The two highest stocks trading on that day were BAC and AAPL.

From the entire analysis, stock volumes are higher on Wednesdays which is closely followed by Friday. However, when you dig deeper you will see that volume tends to be higher on Fridays in 2014, on Wednesdays in 2015, on Fridays in 2016 and Wednesdays in 2017. When you drill down by months for each year you will see the stock volume fluctuating daily.

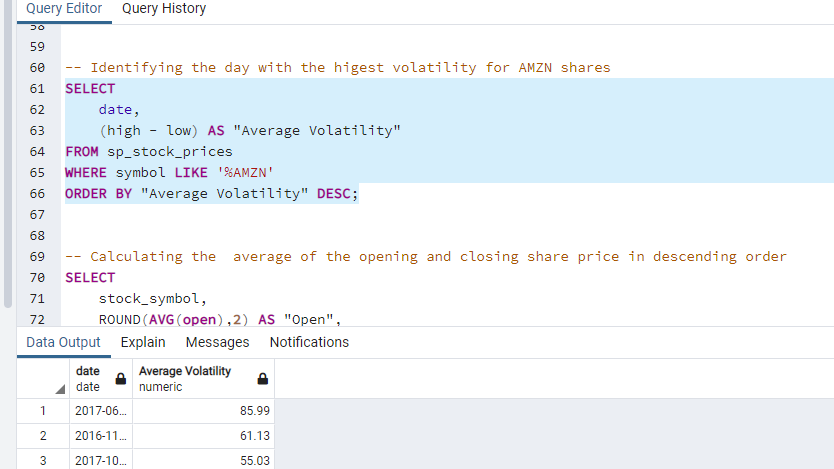
Using SQL to check the average volatility for AMZN products shows that the highest average volatility was witnessed on the 9th of Jun 2017. From the power BI analysis, AMZN shares are increasing quite well. The shares were valued at $328.55 in 2014, this value increase and became $960.72 in 2017, which is a 192% increase from the share price in 2014.
Looking at the visuals, the daily overall trading volume shows that the two stocks with the highest trading were AAPL and AMD. However, when you drill down and check yearly you will find that for 2014 and 2015, AAPL and BAC were the highest trading stocks daily. In 2016 the trading volume for AMD increased, and in 2017, the trading volume for AAPL greatly reduced

From the overall analysis, the company with the highest trading volume is BAC. The average low stock price for BAC went from $76.27 in 2014 to $97.98 in 2017. The average low stock price for AAPL was $91.48 in 2014 and it went as high as $149.52 in 2017 however, the trading volume declined over the years. The trading volume for AMD increased significantly, this could be as a result of the very low stock price.

Looking at the average volatility by company shows that PCLN has the highest average volatility of about $24.76. From the analysis we can see that PCLN is not among the stocks with the highest trading volume, this could be because of the relatively high stock price, but it is important to note that this stock is relatively stable as the stock is not reducing.

Recommendations:
I recommend purchasing AMZN shares as they seem to be increasing quite well.
PCLN seems to be stable. Risk-averse individuals could look into purchasing these shares.
GOOGL shares are also worth paying attention to, and maybe purchasing as the share price increased over the years.
The stocks with the highest volume are not necessarily the stock that generates the highest returns from shares. When looking at stocks to invest in, the trading volume may not affect the purchasing decision.
The slides I prepared for this analysis is here: https://bit.ly/3qypN6i
The SQL queries are here: https://github.com/Okaks/Stock_Prices_Analysis


Comments